ping通tcp不通


linux 机器

TraceRoute 实现原理

Traceroute是用来侦测主机到目的主机之间所经路由情况的重要工具。

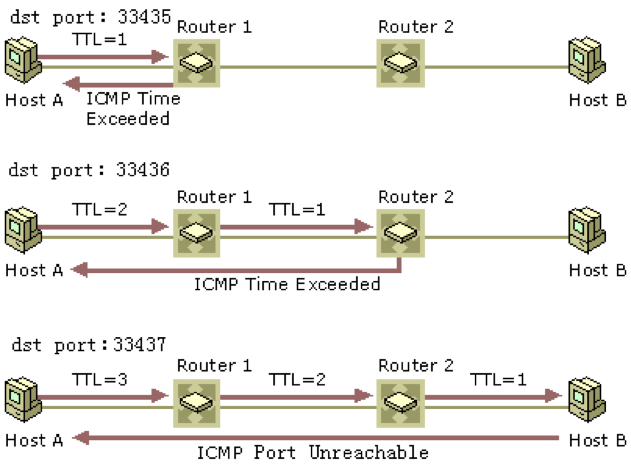
  1. 从源地址发出一个UDP探测包到目的地址,并将TTL设置为1;
  2. 到达路由器时,将TTL减1;
  3. 当TTL变为0时,包被丢弃,路由器向源地址发回一个ICMP超时通知(ICMP Time Exceeded Message),内含发送IP包的源地址,IP包的所有内容及路由器的IP地址;
  4. 当源地址收到该ICMP包时,显示这一跳路由信息;
  5. 重复1~5,并每次设置TTL加1;
  6. 直至目标地址收到探测数据包,并返回端口不可达通知(ICMP Port Unreachable);
  7. 当源地址收到ICMP Port Unreachable包时停止traceroute。
  1. Linux和Mac OS等系统使用UDP包进行探测,目标端口号默认为33434,每次探测目标端口号加1。Traceroute故意使用了一个大于 30000 的目标端口号,以保证目标地址收到数据包后能够返回一个“端口不可达”的 ICMP 报文,于是源地址就可将端口不可达报文当作跟踪结束的标志。
  2. Traceroute每跳默认发送3个探测包(发包的数量可通过-q进行设置),探测包的返回会受到网络情况的影响。如果防火墙封掉了ICMP的返回信息,那么相应的延时位置会以*显示。如果某台网关阻塞或者某台DNS出现问题,那么相应行的延时会变长。可以加-n 参数来避免DNS解析,以IP格式输出数据。
  3. 每个探测包都有唯一的标识号,使得Traceroute能够识别返回的包。UDP数据包使用递增的目标端口号进行标识。

1
traceroute [-n] -T -p <目标端口号> Host

参数说明

1
2
3
4
5
6
7
8
9
10
11
12
13
14
15
16
17
18
19
20
21
22
23
24
25
26
27
28
29
30
31
32
33
34
35
36
37
38
39
40
41
traceroute [-46dFITUnreAV] [-f first_ttl] [-g gate,...]
[-i device] [-m max_ttl] [-p port] [-s src_addr]
[-q nqueries] [-N squeries] [-t tos]
[-l flow_label] [-w waittime] [-z sendwait] [-UL] [-D]
[-P proto] [--sport=port] [-M method] [-O mod_options]
[--mtu] [--back]
host [packet_len]
traceroute6 [options]

Host 目标服务器域名或 IP。
-4, -6 指定使用 IPv4 or IPv6
-I 使用icmp探测
-T 通过 TCP 探测
-n 直接使用 IP 地址而非主机名称(禁用 DNS 反查)。
-p port
对于UDP跟踪,指定将使用的目标端口基traceroute(目标端口号将由每个探测递增)。
对于ICMP跟踪,指定初始ICMP序列值(也由每个探测递增)。
对于TCP和其他端口,只指定要连接的(常量)目标端口。
-r 绕过常规路由表,直接发送到连接网络上的主机。如果主机不在直接连接的网络上,则返回错误。此选项可用于通过没有路由的接口ping本地主机。
-m max_ttl 默认最多30跳
-w waittime 每一跳最多等待多长时间,默认5秒
-g gateway 指定包出口网关
-i interface 指定网卡名
-s source_addr 指定源ip(必须是某个网卡ip)
-z sendwait 指定每一跳的时间间隔(默认0)
-e, --extensions 显示ICMP扩展(rfc4884)。一般形式是类/类型:后跟十六进制转储。MPLS(rfc4950)以如下形式显示:MPLS:L=label,E=exp_use,S=stack_bottom,T=TTL(更多由/)分隔的对象。
-A 在路由注册表中执行路径查找,并在相应地址后直接打印结果。
-q num, 每个网关发送num个数据包

-------------
--sport=port 选择一个源端口
--fwmark=mark 设置一个防火墙标记
-U, --udp 使用udp协议探测目标端口
-UL, 使用 UDPLITE 进行探测
-D, 使用DCCP(数据包拥塞控制协议)请求进行探测
-P protocol,使用指定协议的原始数据包进行跟踪路由。默认协议是253
--mtu 路径MTU是指一条因特网传输路径中,从源地址到目的地址所经过的“路径”上的所有IP跳的最大传输单元的最小值。或者从另外一个角度来看,就是无需进行分片处理就能穿过这条“路径”的最大传输单元的最大值。
--back 响应包可能与探测包路径不同,打印响应包的跳数


更多关于 traceroute 的用法,您可以通过man帮助查阅。

异常节点判定方法:如果相关端口在某一跳被阻断,则其后各跳均不会返回数据。据此就可以判定出异常节点

1
2
3
4
5
6
7
8
9
10
11
12
13
14
15
16
17
18
19
20
[root@10-1-53-21 ~]# traceroute -n -T -p 443 183.3.217.36
traceroute to 183.3.217.36 (183.3.217.36), 30 hops max, 60 byte packets
1 172.23.0.43 0.099 ms 0.051 ms 0.035 ms
2 172.23.0.254 4.176 ms 4.487 ms 4.789 ms
3 10.1.255.6 0.307 ms 0.425 ms 0.420 ms
4 122.115.48.65 3.080 ms 3.535 ms 3.806 ms
5 10.78.3.5 6.626 ms 7.133 ms 7.533 ms
6 172.16.0.1 1.333 ms 1.355 ms 1.454 ms
7 219.142.20.49 1.731 ms 1.738 ms 1.690 ms
8 * * *
9 * * *
10 219.141.152.53 2.621 ms * *
11 * * *
12 * 119.147.222.122 42.294 ms 119.147.220.74 39.959 ms
13 113.106.51.70 39.030 ms 38.859 ms 113.106.51.86 35.560 ms
14 113.106.52.134 39.720 ms 40.552 ms 41.223 ms
15 183.3.217.36 34.676 ms 36.169 ms 36.221 ms
16 * * *
17 * * *
18 183.3.217.36 38.777 ms 39.290 ms 39.291 ms
1
2
3
4
5
6
7
8
9
10
11
12
13
14
15
16
17
18
19
20
21
22
23
24
25
26
27
28
29
30
31
32
[root@10-1-53-21 ~]# traceroute -n -T -p 443 183.3.217.36
traceroute to 183.3.217.36 (183.3.217.36), 30 hops max, 60 byte packets
1 172.23.0.43 0.127 ms 0.101 ms 0.084 ms
2 172.23.0.254 5.911 ms 7.257 ms 7.248 ms
3 10.1.255.6 0.451 ms 0.441 ms 0.426 ms
4 122.115.48.65 3.120 ms 3.574 ms 3.813 ms
5 10.78.3.5 6.859 ms 7.208 ms 7.575 ms
6 172.16.0.1 1.258 ms 1.364 ms 1.429 ms
7 219.142.20.49 10.966 ms 10.785 ms 10.764 ms
8 * * *
9 * * *
10 219.141.152.61 3.043 ms 219.141.152.65 6.084 ms *
11 * * *
12 * * *
13 113.106.51.86 36.000 ms 35.589 ms 113.106.51.82 36.043 ms
14 113.106.52.130 41.988 ms 113.106.52.134 38.881 ms 39.337 ms
15 183.3.217.36 35.303 ms 36.716 ms 36.751 ms
16 * * *
17 * * *
18 * * *
19 * * *
20 * * *
21 * * *
22 * * *
23 * * *
24 * * *
25 * * *
26 * * *
27 * * *
28 * * *
29 * * *
30 * * *
1
2
3
4
5
6
7
8
9
10
11
12
13
14
15
16
17
18
19
20
21
22
23
24
25
26
27
28
29
30
31
32
33
yum install -y sshpass

nc 183.3.217.36 443
nc -vz jzjyszdx01.jzsec.com 443
nc -vz 183.3.217.36 443
traceroute 183.3.217.36
ping 183.3.217.36
sshpass -p 'sdfsfsdfsgg' ssh root@10.198.45.139
sshpass -p 'sdfsfsdfsgg' ssh root@10.198.45.141
traceroute -n -T -p 443 183.3.217.36
traceroute -4nTe -p 443 -m 40 183.3.217.36
traceroute -4nIe -m 40 183.3.217.36
traceroute -4nUe -p 443 -m 40 183.3.217.36
traceroute -4nTe -m 40 -p 22 10.198.45.139

nc 112.95.153.36 443
nc -vz jzjyszlt01.jzsec.com 443
nc -vz 112.95.153.36 443
traceroute -m 40 112.95.153.36
traceroute -n -T -p 443 112.95.153.36
traceroute -4nTe -p 443 -m 40 112.95.153.36
sshpass -p 'sdfsfsdfsgg' ssh root@10.198.45.140
sshpass -p 'sdfsfsdfsgg' ssh root@10.198.45.142


[root@10-1-53-21 ~]# nc 183.3.217.36 443
123ewq
[root@10-1-53-21 ~]# netstat -atn | grep "ES" | grep 183.3.217.36
[root@10-1-53-21 ~]# netstat -atn | grep "ES" | grep 112.95.153.36
[root@10-198-45-139 ~]# tcpdump 'tcp and src 122.115.48.123 and dst port 443 and (((ip[2:2] - ((ip[0]&0xf)<<2)) - ((tcp[12]&0xf0)>>2)) < 20)' -XX
[root@10-198-45-139 ~]# tcpdump 'tcp and src 43.227.140.124 and dst port 443 and (((ip[2:2] - ((ip[0]&0xf)<<2)) - ((tcp[12]&0xf0)>>2)) < 20)' -XX
tcpdump 'tcp and dst port 443 and (0 < ((ip[2:2] - ((ip[0]&0xf)<<2)) - ((tcp[12]&0xf0)>>2))) and (((ip[2:2] - ((ip[0]&0xf)<<2)) - ((tcp[12]&0xf0)>>2)) < 20)' -XX

windows 机器

1
tracetcp <目标服务器域名或 IP>:<待探测端口号>

异常节点判定方法:如果相关端口在某一跳被阻断,则其后各跳均不会返回数据。据此就可以判定出异常节点

Tracert实现原理

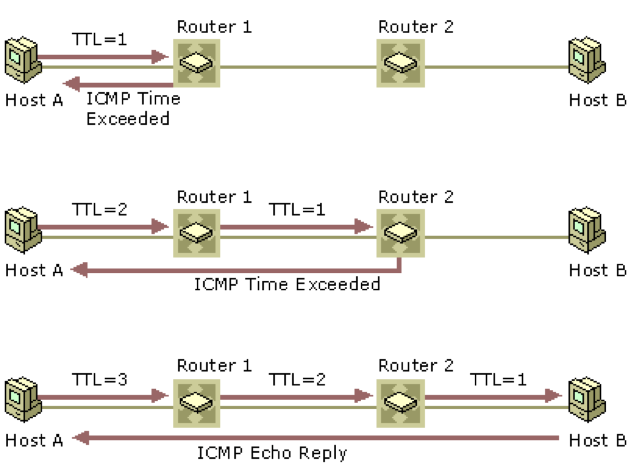
  1. 从源地址发出一个ICMP请求回显(ICMP Echo Request)数据包到目的地址,并将TTL设置为1;

  2. 到达路由器时,将TTL减1;

  3. 当TTL变为0时,包被丢弃,路由器向源地址发回一个ICMP超时通知(ICMP Time Exceeded Message),内含发送IP包的源地址,IP包的所有内容及路由器的IP地址;

  4. 当源地址收到该ICMP包时,显示这一跳路由信息;

  5. 重复1~5,并每次设置TTL加1;

  6. 直至目标地址收到探测数据包,并返回ICMP回应答复(ICMPEcho Reply);

  7. 当源地址收到ICMP Echo Reply包时停止tracert。

注:

1.Windows系统使用ICMP请求回显(ICMP Echo Request)数据包进行探测,源地址以目的地址返回的ICMP回应答复(ICMP Echo Reply)作为跟踪结束标志。

2.Traceroute每跳默认发送3个探测包。在未能到达路由器或未返回ICMP超时通知的情况下,相应的延时位置会以*显示。

3.每个探测包都有唯一的标识号,ICMP数据包使用seq进行标识。

tracetcp

安装依赖

https://www.winpcap.org/

下载tracetcp,解压后放在c:/windows下

1
http://www.github.com/simulatedsimian/tracetcp
1
2
3
4
5
6
7
8
9
10
11
12
13
14
15
16
17
18
19
20
21
22
23
24
25
26
27
28
29
30
31
32
33
34
35
36
37
38
39
40
41
42
43
44
45
46
47
48
tracetcp host [options]
where host = hostName|ipAddress[:portNumber|serviceName]
if portNumber or serviceName is not present then port 80 (http)
is assumed.

Options:
-? Displays help information.

-c Select condensed output mode

-h start_hop Starts trace at hop specified.

-m max_hops Maximum number of hops to reach target.

-n No reverse DNS lookups for each node.

-p num_pings # of pings per hop (default 3).

-r p1 p2 Multiple traces from port p1 to p2.

-t timeout Wait timeout milliseconds for each reply.

-v Displays version information.

-s p1 p2 Easy port scan mode. gives the same result as
setting the following options:
-cnr p1 p2 -h 128 -m 1 -p 1

-F Disables the Anti-flood timer. Normally tracetcp
waits *at least* 0.5 seconds between sending out
each packet, because if the packets are sent too
fast some host seem to detect this as some form of
flood and stop responding for a time. This option
disables the 0.5 second timer, so the traces occur
faster.

-R Use raw socket interface to send/receive packets
this will not work on XP sp2.
(you still need winpcap installed)

-g address use the specified host as a a gateway to remote
systems rather than the default gateway.


Examples:
tracetcp www.microsoft.com:80 -m 60
tracetcp post.sponge.com:smtp
tracetcp 192.168.0.1 -n -t 500

itracert

tcping

httpping